Next: Effects of long-term trends and outliers on MSE Up: Generalized Multiscale Entropy (GMSE) Analysis: Quantifying the Structure Previous: Considerations regarding the selection of the parameter r
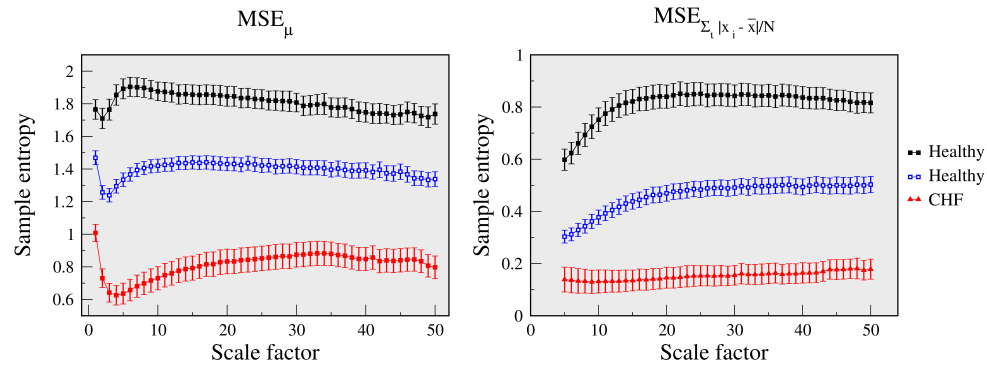
We show the MSE analysis (Fig. 3) of RR interval time series using i)
the mean and ii) the mean absolute deviation
(
![]() )
metrics for coarse-graining the time series. The parameter r is
fixed at 8 ms. (The mean absolute difference is another measure of
local variability.) The results indicate that healthy young subjects
have the highest dynamical complexity, when considering both
fluctuations in the mean and the mean absolute deviation
(dispersion). The degrees of separation among the groups obtained with
MSEμ and MSEMAD are qualitatively comparable. (The area under
the curve (AUC) of younger versus older is 0.85 and 0.88 for
MSEμ and MSEMAD, respectively. The AUC of healthy older
individual versus patients with CHF is 0.85 and 0.90 for MSEμ
and MSEMAD, respectively.
)
metrics for coarse-graining the time series. The parameter r is
fixed at 8 ms. (The mean absolute difference is another measure of
local variability.) The results indicate that healthy young subjects
have the highest dynamical complexity, when considering both
fluctuations in the mean and the mean absolute deviation
(dispersion). The degrees of separation among the groups obtained with
MSEμ and MSEMAD are qualitatively comparable. (The area under
the curve (AUC) of younger versus older is 0.85 and 0.88 for
MSEμ and MSEMAD, respectively. The AUC of healthy older
individual versus patients with CHF is 0.85 and 0.90 for MSEμ
and MSEMAD, respectively.
|