Software Open Access
Software for computing Heart Rate Fragmentation
Published: Feb. 14, 2024. Version: 1.0.0
When using this resource, please cite:
(show more options)
Costa, M. (2024). Software for computing Heart Rate Fragmentation (version 1.0.0). PhysioNet. https://doi.org/10.13026/0mzj-gn98.
Please include the standard citation for PhysioNet:
(show more options)
Goldberger, A., Amaral, L., Glass, L., Hausdorff, J., Ivanov, P. C., Mark, R., ... & Stanley, H. E. (2000). PhysioBank, PhysioToolkit, and PhysioNet: Components of a new research resource for complex physiologic signals. Circulation [Online]. 101 (23), pp. e215–e220.
Abstract
Heart rate fragmentation (HRF) is a new method for assessing neuroautonomic integrity based on the analysis of short-term (high-frequency [HF]) heart rate dynamics. The code (in AWK) provided here is for the computation of three different metrics, PIP, PNNLS, and PNNSS introduced in 2017 by Costa and colleagues.
The motivation for developing HRF was the recognition that changes in heart rate (HR) above the respiratory frequency not only inflate the value of traditional heart rate variability (HRV) metrics, such as rMSSD and HF power, but are a dynamical marker of cardioautonomic dysfunction.
In healthy subjects, HR increases with inspiration and decreases with expiration, defining a “high-frequency” pattern referred to as respiratory sinus arrhythmia. This physiologic oscillation is driven primarily by changes in vagal tone. In contexts in which cardio-respiratory coupling is degraded, e.g., with aging and disease, non-vagally mediated oscillations whose frequencies are higher than the breathing frequency may develop. Non-vagally mediated fluctuations are characterized by an excess of reversals in HR acceleration. The simplest measure of HRF is the percentage of “inflection points,” (PIP) i.e., of changes in HR acceleration sign. Of key importance is fact that traditional short-term HRV measures can be high for two opposite reasons, one healthy – respiratory sinus arrhythmia – consistent with high vagal tone modulation, and one pathologic – fragmented rhythms – consistent with decreased/impaired vagal activity.
Increased HRF has been shown to be independently associated with higher risk of incident major adverse cardiovascular events and atrial fibrillation. These results have been independently confirmed, as described in Background section.
Background
A critical barrier in traditional heart rate variability (HRV) analysis
A key reason that traditional HRV indices have yet to fulfill their translational promise is the fact that they are susceptible to major physiologic misinterpretations. As cautioned by the influential 1996 International Task Force on HRV [1]: "The significance and meaning of the many different measures of HRV are more complex than generally appreciated and there is a potential for incorrect conclusions and for excessive or unfounded extrapolations."
The interpretative framework underlying traditional HRV analyses equates the amplitude of beat-to-beat variations in NN intervals with the degree of parasympathetic activity (vagal tone modulation) [1]. Given this assumption, short-term HRV indices are used as noninvasive "assays" of effective vagal activity. These indices quantify changes in heart rate (HR) in the range of 0.15 to 0.4 Hz, which in the time domain corresponds to 9 to 24 cycles/min (physiologic respiratory rate). (The terms short-term and high-frequency are typically used interchangeably.)
Almost invariably, physiologic (i.e., healthy) vagal activity decreases with aging and organic heart disease. In these contexts, a consistent reduction in short-term/high-frequency HRV is expected [2, 3]. However, multiple studies have reported no-changes or even a counterintuitive increase in the amounts of short-term variability in high-risk individuals [4, 9]. We [10-12] refer to the occurrence of high HRV in settings where highly diminished vagal tone modulation is anticipated as the "HRV paradox.”
Scientific premise for the quantification of HRF in middle-age to older individuals
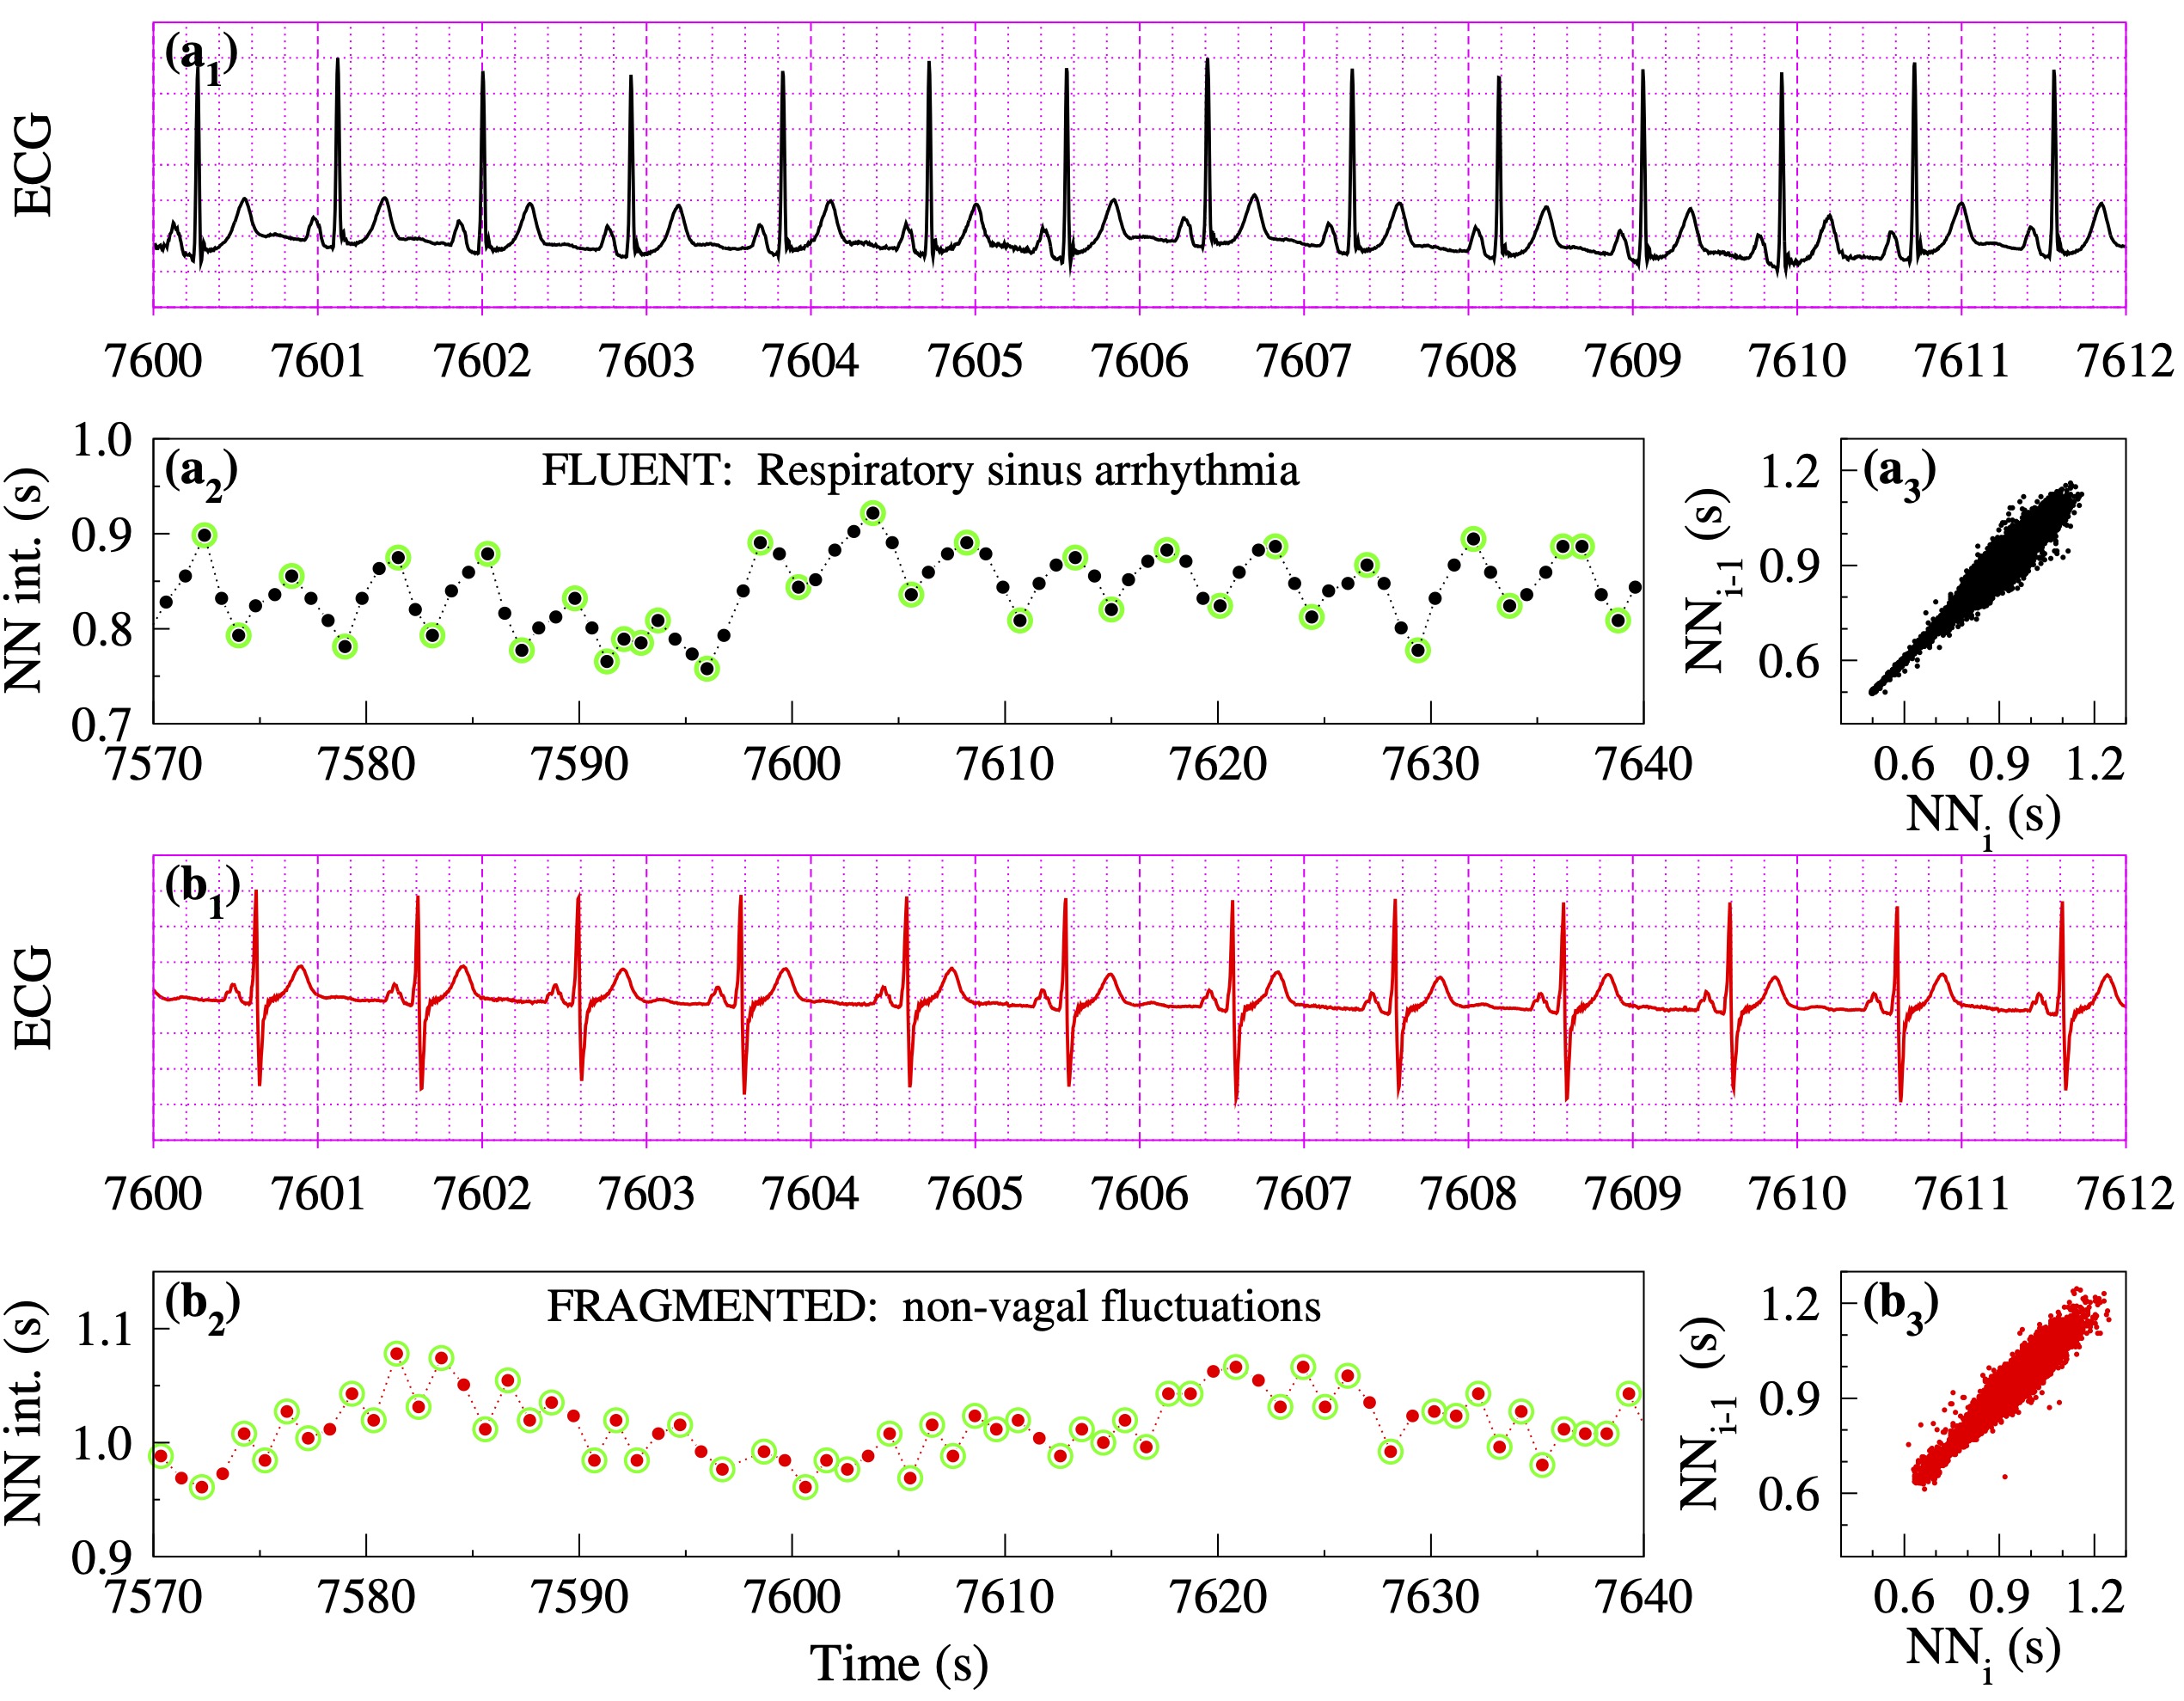
In healthy subjects, particularly over short time scales, HRV is primarily attributable to fluctuations in vagal tone. The most recognizable manifestation of this parasympathetic influence is the NN interval oscillatory pattern called respiratory sinus arrhythmia (Fig. 1, panel a2), which results from the vagally-mediated coupling between breathing and HR.
With aging and especially CV disease, oscillations in NN intervals (or equivalently in HR) above the respiratory frequency may develop (Fig. 1, panel b2). These fast fluctuations, which are not attributable to physiologic vagal tone modulation, can confound traditional HRV analysis by inflating the values of short-term metrics such as rMSSD and high-frequency power [10-15]. Importantly, the emergence of such fluctuations is itself a marker of sinoatrial-cardioautonomic dysfunction. While this has been previously recognized [17, 18], the lack of computational metrics to quantify these types of rhythms continued to stymie progress.
Our identification of the distinctive dynamical feature that characterizes fluctuations in heart rate above the respiratory frequency led to the introduction of a set of metrics for their quantification under the rubric of heart rate fragmentation, HRF [10, 11].
A visually apparent difference between vagally and non-vagally mediated HR fluctuations is their degree of smoothness, or conversely, their degree of fragmentation. Non-vagally mediated HR fluctuations are characterized by an excess of reversals in HR acceleration, i.e., a higher percentage of transitions from acceleration to deceleration (or no-change) and vice-versa, which we termed fragmentation [16, 17].
As shown in Fig. 1 [18], HRF may not be easily recognizable from ECG recordings or detected by widely used HRV tools including nonlinear measures and metrics derived from Poincaré plots. The data in this figure are from two participants in the Multi-Ethnic Study of Atherosclerosis (MESA), both with sinus rhythm, one physiologic ("a") and the other with a highly fragmented variant ("b"). The participants, a 54 year-old female and a 66 year-old male, had no prevalent or incident CVEs. Traditional HRV indices as well as commonly used nonlinear indices (e.g., DFA alpha 1) were comparable in both individuals. Analysis of Poincaré plots (a3, b3) also did not suggest major differences in the temporal structure of HRV. However, participants "a" and "b" were in different risk groups: their Framingham 10-year CV risk indices [19] were 2.4% (1st percentile) and 15.6% (55th percentile), respectively. Closer inspection of the beat-to-beat (short-term) variations in NN intervals (a2, b2) reveals a major difference: the frequency of reversals in HR acceleration (inflection points) was much higher for participant "b" than participant "a". In fact, the latter was 35% more fragmented than the former (for the entire sleep period). Here, fragmentation is quantified by the percentage of inflection points (PIP).

Figure 1. Heart rate dynamics from two participants in the Multi-Ethnic Study of Atherosclerosis (MESA) with comparable values of traditional HRV and nonlinear indices: (a₁, b₁) ECGs, (a₂, b₃) NN interval time series, and (a₃, b₃) Poincaré graphs for the full sleep period. The green circles in panels a₂ and b₂ highlight "inflection points," where reversals in HR acceleration occur. The fragmentation index, percentage of inflection points (PIP), is 50% lower in the NN segment (a₂) of participant "a" (33/83100 = 40%) than in the NN segment (b₂) of participant "b" (54/68100 = 79%). (Adapted from [18].)"
HRV versus HRF
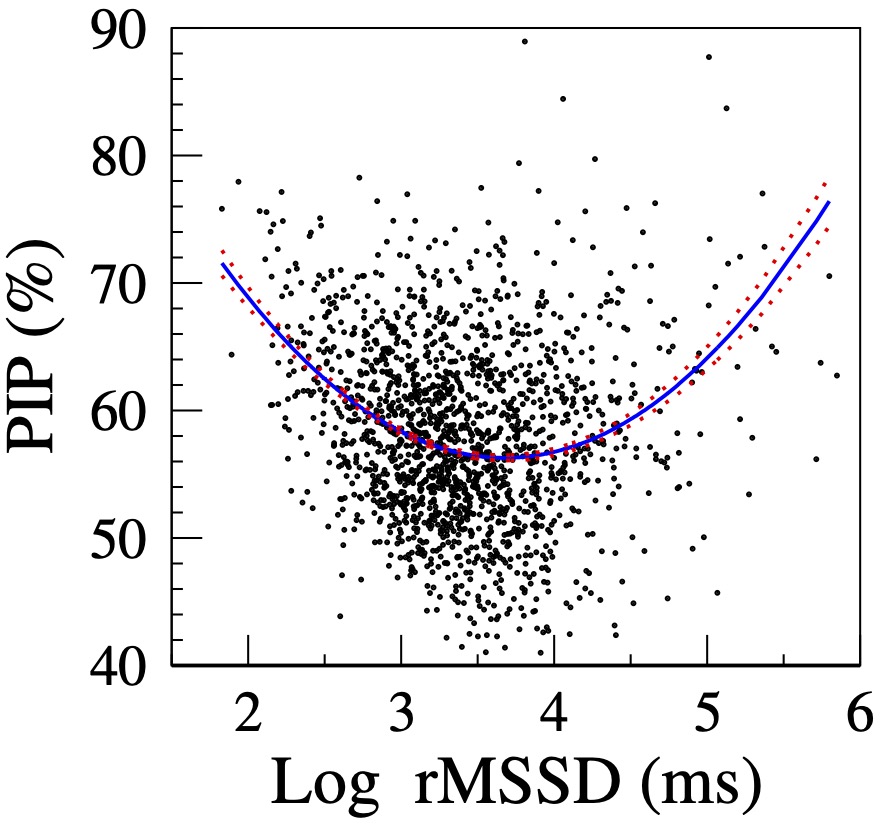
Figure 2 shows the relationship between HRF and short-term HRV in a MESA sub-cohort [18]. Since rMSSD is not normally distributed, ln rMSSD rather than rMSSD is shown. Initially, as variability (ln rMSSD) increases, fragmentation (PIP) decreases, i.e., HRV and HRF are inversely correlated. Subsequently, in the second part of the curve (ln rMSSD > 3.5), as variability increases, fragmentation also increases, i.e., HRV and HRF are positively correlated. Thus, both the participants with the lowest and the highest amounts of variability have high HRF.

Figure 2. Relationship between PIP and log rMSSD. The solid and dotted lines are the quadratic fitted line and the standard errors of the fitted values, respectively. (Adapted from [18].)
The HRF construct resolves the "HRV paradox" by revealing two major mechanisms of high-frequency/short-term fluctuations in heart rate: 1) physiologic vagal tone modulation and 2) sinus rhythm fragmentation. The former is a marker of intact heart rate control, the latter of its breakdown.
Translational applications of HRF metrics
We have reported that: (i) HRF monotonically increased with cross-sectional age both in healthy subjects and in those with coronary artery disease [10-12]; (ii) increased HRF, but not reduced HRV, was independently associated with the incidence of major adverse cardiovascular events [18]; and (iii) atrial fibrillation [20]. These findings have been validated by other groups [15, 21-23]. We have also shown that HRF is independently associated with cognitive performance and future cognitive decline [24, 25]. These results were consistent with our subsequent finding that increased HRF was associated with brain small vessel disease, namely with greater white matter hyperintensity volume and lower white matter fractional anisotropy, as assessed by MRI [26].
Others investigators are adding to this line of research. For example, Sawayama and colleagues [27, 28] found that higher HRF was associated with greater coronary calcification (CAC), independent of traditional risk factors. The association was similar in magnitude to the association between mean ambulatory systolic blood pressure and CAC.
We have also used the difference in HRF before and after sleep to quantify the impact of sleep on cardiac neuroautonomic control. In MESA, we showed that such difference (∆HRF) decreased with cross-sectional age and was associated with incident major adverse cardiovascular events independently of traditional cardiovascular risk factors [29]. Overall these findings demonstrate the potential translational utility of HRF metrics for a range of syndromes associated with aging [12].
Underlying mechanisms of HRF
The basic mechanisms of HRF as well as of its most extreme manifestation, an arrhythmia termed sinoatrial (SA) alternans, remain to be elucidated [10-12,18]. Speculatively, pathogenetic considerations center on degradation of vagal control and/or perturbed automaticity/conduction in the SA node pacemaker complex. The latter, in turn, could related to modulated SA node parasystole, very subtle supraventricular ectopy from the area near or even within the heterogeneous SA node tissue, perturbations of membrane and cellular pacemaker clocks, as well as to altered mechano-electrical coupling [10, 11, 30]. These basic mechanisms of electrodynamical remodeling are most likely to develop in the context of impaired vagal control, inflammation or fibrosis. Thus, HRF, itself, may serve as a biomarker of systemic inflammatory processes [12, 18, 28].
Software Description
This code, written in awk is for the computation of three metrics quantifying the overall degree of HRF. These metrics are denoted PIP, PNNLS, and PNNSS and quantify, respectively the percentage of inflection points and of NN intervals in long and short NN sequences. A sequence is described as long (short) if it contains ≥ 3 (<3) ∆NN intervals [20]. The input to the code is a two column file, the first containing the time of successive R peaks and the second the corresponding beat label (1, normal sinus beat; 2, premature atrial complex [PAC]; 3, premature ventricular complex [PVC]). The code calculates the fragmentation metrics exclusively using normal sinus beats.
Technical Implementation
HRF Metrics
The computation of HRF metrics is described here for the three cardiac interbeat interval test timeseries shown in Figure 3.
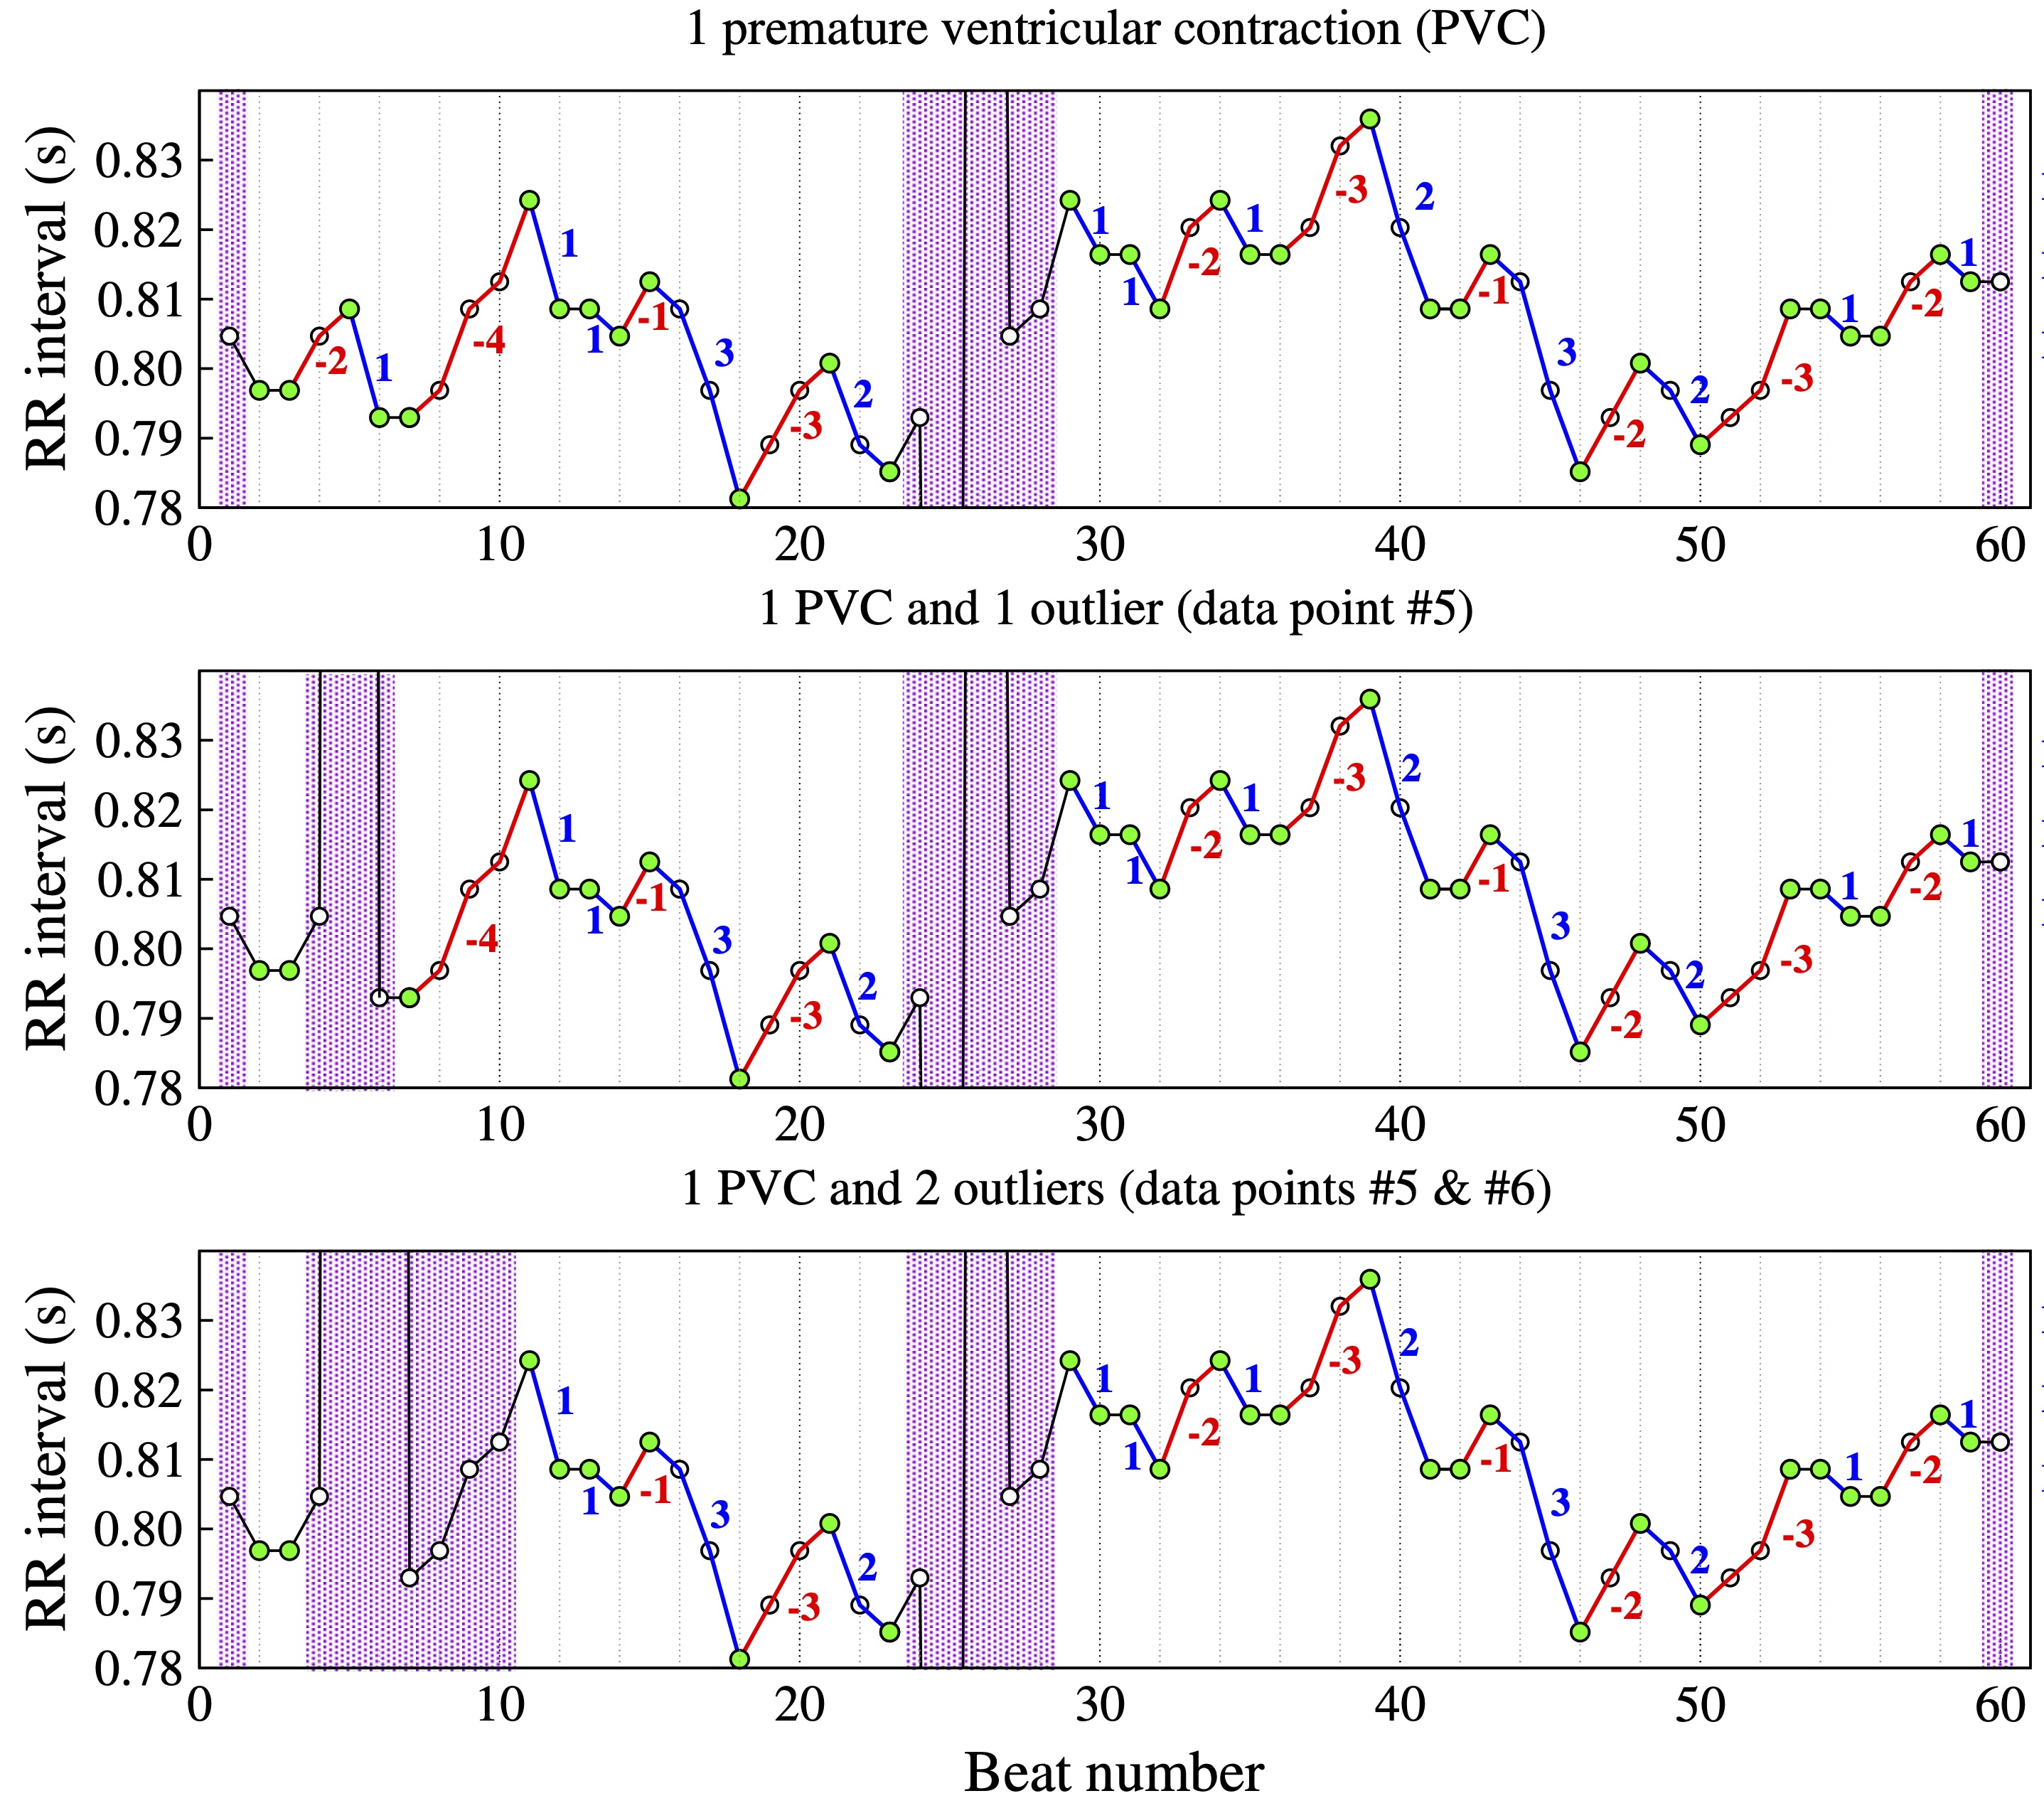
Figure 3. Example of NN interval time series with one premature contraction (PVC) (top), one PVC and one outlier (middle) and one PVC and two consecutive outliers (bottom). The inflection points are denoted by the green circles. Accelerative and decelerative segments are denoted by the blue and red lines, respectively. (Adapted from [20].)
Let r represent the "acceptable" level of noise. Two data points are considered indistinguishable ("equal") if the difference between them is less than r (i.e., -r < NN (i+1) – NN (i) < r ). For electrocardiographic (ECG) recordings sampled at 250 Hz, a suggested choice of r is 0.004 s, i.e., the inverse of the ECG sampling frequency (1/250).
Let ∆NN (i) represent NN(i+1) – NN (i). Accelerative and decelerative changes in heart rate are defined as ∆NN(i) ≤ -r and ∆NN(i) ≥ r, respectively. Note that heart rate and NN intervals are inversely related; when the NN interval increases, heart rate decreases and vice-versa. Accelerative (decelerative) segments are sequences of accelerative (decelerative) changes. So-called short and long segments comprise < 3 and ≥ 3 ∆NN(i) intervals, respectively.
A NN(i) interval is an inflection point if (a) ∆NN(i+1) x ∆NN(i) ≥ 0 and (b) ∆NN(i+1) ≠ ∆NN(i).
Three inter-related metrics of overall degree of fragmentation [20] are:
- PIP, Percentage of Inflection Points.
- PNNSS, Percentage of ∆NN intervals in Short accelerative and decelerative Segments.
- PNNLS, Percentage of ∆NN intervals in Long accelerative and decelerative Segments.
Figure 3 shows interbeat interval (RR) time series with (top) a premature ventricular complex (PVC), (middle) a PVC and one outlier, and (bottom) a PVC and two outliers. The green circles mark the inflection points. Note that for a given data point (e.g., NN(i)) to be classified an inflection point, the data points to its left, NN(i-1), and the one to its right, NN(i+1), have to represent the difference between two consecutive normal sinus beats.
The purple bars highlight regions excluded from the analysis. These regions include segments whose lengths are not knowable either because they are located at the extrema (beginning/end) of the time series or because the sequence of normal-to-normal (NN) beats is interrupted by outliers (middle graph, data point #5; bottom graph, data points #5 and #6) or premature beats (data point #25). The begin and end of the deleted segments are the closest inflection points to the left and right of the premature beat/outlier, respectively. Blue and red lines mark heart rate accelerative and decelerative segments, respectively.
Time series A (Fig. 3, top) comprises 60 NN interbeat intervals. After excluding the first, the last and the five data points in the region of the premature beat, the number of NN intervals in time series A is 53 and the number of ∆NN intervals is 51.
For time series B (Fig. 3, middle), three additional points are excluded: the outlier (#5), and the data points #4 and #6. Thus, the number of NN intervals in time series B is 50 and the number of ∆NN intervals is 47.
In the case of time series C (Fig 3, bottom), the number of data points excluded due to the two outliers (#5 and #6) is seven. Thus, the number of NN intervals 46 and the number of ∆NN intervals is 43. Note that data point #7 is not an inflection point. While the ∆NN interval to the right of data point #7 is in fact the difference between two NN intervals, NN(8)–NN(7), the ∆ to its left is the difference between the outlier point and NN(7).
PIP is defined as the number of inflection points over the total number of data points (not counting the data points in the excluded segments).
PNNSS is defined as the number of ∆NN intervals in short accelerative and decelerative segments divided by the total number of ∆NN intervals in all (short and long) accelerative and decelerative segments.
PNNLS is defined as the number of ∆NN intervals in long accelerative and decelerative segments divided by the number of ∆NN intervals in accelerative, decelerative and no-change segments. The values of PIP, PNNSS and PNNLS for the time series shown in Figure 1 are given in Table 1.
| A | B | C | |
|---|---|---|---|
| PIP | 33/53 | 31/50 | 30/46 |
| PNNSS | 24/43 | 21/40 | 21/36 |
| PNNLS | 19/51 | 19/47 | 15/43 |
| # NN | 53 | 50 | 46 |
| # ∆NN | 51 | 47 | 43 |
| # ∆NN in accelerative/decelerative segments | 43 | 40 | 36 |
All values should be multiplied by 100 to obtain percentages.
Input data format
The code reads ASCII files with two columns. The first is the time of the R peaks and the second is the beat label (1, normal sinus beat; 2, premature atrial complex [PAC]; 3, premature ventricular complex [PVC]).
Example of Input File
| 0.000 | 1 |
| 0.804 | 1 |
| 1.600 | 1 |
| 2.396 | 1 |
| 3.200 | 1 |
| 4.008 | 1 |
| 4.800 | 1 |
| 5.592 | 1 |
| 6.392 | 1 |
| 7.200 | 1 |
Installation and Requirements
No installation needed.
Usage Notes
The awk code can be run in the terminal of Linux and Mac machines. Additionally, the code can be run in Window machines using for example Cygwin.
Usage
Example command line usage:
awk -f HRF.awk < Input file > Output file
Three test time series were created with: (A) one premature ventricular contraction (PVC) (Fig. 3 top); (B) one PVC and one outlier (Fig. 3 middle); and (C) one PVC and two outliers (Fig. 3 bottom). The filenames of theses files are timeseries_1PVC, timeseries_1PVC_1outlier and timeseries_1PVC_2outliers, respectively. The values of each of the metrics (Table 1) are:
- timeseries_1PVC.txt: PIP = 33/53 = 62.264; PNNSS = 24/43*100 = 55.814; PNNLS = 19/51*100 =37.255
- timeseries_1PVC_1outlier.txt: PIP = 31/50 = 62.000; PNNSS = 21/40*100 = 52.500; PNNLS =19/47*100 = 40.426
- timeseries_1PVC_2outliers.txt: PIP = 61/96 = 63.542; PNNSS = 42/76*100 = 55.263; PNNLS =34/90*100 = 37.778
The test time series provided are very short (~ 50 data points) to allow the user to manually verify the computations. At the time of this writing, HRF has been applied to daytime, nighttime and 24-h time series.
HRF metrics apply to cardiac normal-to-normal interbeat intervals (i.e., time series derived from sinus rhythm). Since NN intervals below 0.3 s cannot be physiologic and those above 1.5 are most likely due to non-detection of a QRS complex, the code automatically excludes NN intervals < 0.3 s or > 1.5 s. Users can change these thresholds by modifying the values of the variables NN_min and NN_max. Additionally, the default ECG sampling frequency is 250 Hz, which can be modified by updating the value of the variable SF.
How the resource has already been used
The HRF method has been used by us as described under Background as well as others, who have confirmed and expanded our findings [15, 21-23, 27, 31] . We have also used the beat-to-beat fragmentation construct to analyze continuous blood pressure (BP) time series [30]. In patients undergoing cardiac surgery with cardiopulmonary bypass, we found that fragmentation of preoperative systolic BP time series was significantly associated with widely used risk scores, namely the Society of Thoracic Surgeons’ (STS) Risk of Morbidity and Mortality index and the European System for Cardiac Operative Risk Evaluation Score (EuroSCORE II), as well as with post-surgical length of stay in the ICU [30].
Potential limitations
By definition, dynamical measures are not constant over time. In the same way that mean heart rate derived from a 10 minute recording may not be a good approximation of heart rate over, for example, two hours, HRF values derived from a short data segment may not constitute a sufficiently reliable approximation of HRF for longer time series. There is no precise minimum window length needed for HRF analysis. In this respect, HRF and HRV analyses are subject to the same types of considerations.
A premature ventricular complex usually gives rise to a short interbeat interval followed by a longer one (compensatory pause) that "creates" two additional inflection points. If the user wishes to quantify the degree of HRF excluding the contribution from premature atrial or ventricular complexes, the metrics have to be derived from the normal-to-normal (NN) intervals.
Ethics
No ethical concerns are associated with the release of this software.
Acknowledgements
The author thanks Dr. Ary Goldberger, the co-developer of heart rate fragmentation, for reviewing the materials provided here.
The author gratefully acknowledge support from the NIH grants R01HL144510, R01EB030362 and R01EB030362–14S1.
Conflicts of Interest
The author has no conflicts of interest to declare.
References
- Task Force of the European Society of Cardiology and the North American Society of Pacing and Electrophysiology. (1996). Heart rate variability: Standards of measurement, physiological interpretation, and clinical use. Circulation, 93(5), 1043-1065. http://doi.org/10.1161/01.CIR.93.5.1043.
- Pikkujämsä, S. M., Mäkikallio, T. H., Sourander, L. B., Räihä, I. J., Puukka, P., Skyttä, J., Peng, C. K., Goldberger, A. L., & Huikuri, H. V. (1999). Cardiac interbeat interval dynamics from childhood to senescence: comparison of conventional and new measures based on fractals and chaos theory. Circulation, 100(4), 393–399. https://doi.org/10.1161/01.cir.100.4.393.
- Kuo, T. B., Lin, T., Yang, C. C., Li, C. L., Chen, C. F., & Chou, P. (1999). Effect of aging on gender differences in neural control of heart rate. The American journal of physiology, 277(6), H2233–H2239. https://doi.org/10.1152/ajpheart.1999.277.6.H2233.
- de Bruyne, M. C., Kors, J. A., Hoes, A. W., Klootwijk, P., Dekker, J. M., Hofman, A., van Bemmel, J. H., & Grobbee, D. E. (1999). Both decreased and increased heart rate variability on the standard 10-second electrocardiogram predict cardiac mortality in the elderly: the Rotterdam Study. American journal of epidemiology, 150(12), 1282–1288. https://doi.org/10.1093/oxfordjournals.aje.a009959.
- Bergfeldt, L., & Haga, Y. (2003). Power spectral and Poincaré plot characteristics in sinus node dysfunction. Journal of applied physiology, 94(6), 2217–2224. https://doi.org/10.1152/japplphysiol.01037.2002.
- Drawz, P. E., Babineau, D. C., Brecklin, C., He, J., Kallem, R. R., Soliman, E. Z., Xie, D., Appleby, D., Anderson, A. H., Rahman, M., & CRIC Study Investigators (2013). Heart rate variability is a predictor of mortality in chronic kidney disease: a report from the CRIC Study. American journal of nephrology, 38(6), 517–528. https://doi.org/10.1159/000357200.
- Raman, D., Kaffashi, F., Lui, L. Y., Sauer, W. H., Redline, S., Stone, P., Cawthon, P. M., Stone, K. L., Ensrud, K. E., Ancoli-Israel, S., Loparo, K., & Mehra, R. (2017). Polysomnographic heart rate variability indices and atrial ectopy associated with incident atrial fibrillation risk in older community-dwelling men. JACC. Clinical electrophysiology, 3(5), 451–460. https://doi.org/10.1016/j.jacep.2016.09.001.
- Geurts, S., Tilly, M. J., Arshi, B., Stricker, B. H. C., Kors, J. A., Deckers, J. W., de Groot, N. M. S., Ikram, M. A., & Kavousi, M. (2023). Heart rate variability and atrial fibrillation in the general population: a longitudinal and Mendelian randomization study. Clinical research in cardiology, 112(6), 747–758. https://doi.org/10.1007/s00392-022-02072-5.
- Wang, K., Ahmadizar, F., Geurts, S., Arshi, B., Kors, J. A., Rizopoulos, D., Sijbrands, E. J. G., Ikram, M. A., & Kavousi, M. (2023). Heart rate variability and incident type 2 diabetes in general population. The journal of clinical endocrinology and metabolism, 108(10), 2510–2516. https://doi.org/10.1210/clinem/dgad200.
- Costa, M. D., Davis, R. B., & Goldberger, A. L. (2017a). Heart Rate Fragmentation: a new approach to the analysis of cardiac interbeat interval dynamics. Frontiers in physiology, 8, 255. https://doi.org/10.3389/fphys.2017.00255.
- Costa, M. D., Davis, R. B., & Goldberger, A. L. (2017b). Heart rate fragmentation: a symbolic dynamical approach. Frontiers in physiology, 8, 827. https://doi.org/10.3389/fphys.2017.00827.
- Costa, M. D., & Goldberger, A. L. (2019). Heart rate fragmentation: using cardiac pacemaker dynamics to probe the pace of biological aging. American journal of physiology. Heart and circulatory physiology, 316(6), H1341–H1344. https://doi.org/10.1152/ajpheart.00110.2019.
- Stein, P. K. ,Yanez, D., Domitrovich, P. P., Gottdiener, J., Chaves, P., Kronmal, R., & Rautaharju, P. (2002). Heart rate variability is confounded by the presence of erratic sinus rhythm. Computing in cardiology, 26, 669–672. https://doi.org/10.1109/cic.2002.1166861.
- Wiklund, U., Hörnsten, R., Karlsson, M., Suhr, O. B., & Jensen, S. M. (2008). Abnormal heart rate variability and subtle atrial arrhythmia in patients with familial amyloidotic polyneuropathy. Annals of noninvasive electrocardiology, 13(3), 249–256. https://doi.org/10.1111/j.1542-474X.2008.00228.x.
- Hayano J, Kisohara M, Ueda N, Yuda E (2020). Impact of heart rate fragmentation on the assessment of heart rate variability. Appl Sci. 10: 3314. doi: 0.3390/app10093314.
- Stein, P. K., Domitrovich, P. P., Hui, N., Rautaharju, P., & Gottdiener, J. (2005). Sometimes higher heart rate variability is not better heart rate variability: results of graphical and nonlinear analyses. Journal of cardiovascular electrophysiology, 16(9), 954–959. https://doi.org/10.1111/j.1540-8167.2005.40788.x.
- Stein, P. K., Le, Q., Domitrovich, P. P., & CAST Investigators (2008). Development of more erratic heart rate patterns is associated with mortality post-myocardial infarction. Journal of electrocardiology, 41(2), 110–115. https://doi.org/10.1016/j.jelectrocard.2007.11.005.
- Costa, M. D., Redline, S., Davis, R. B., Heckbert, S. R., Soliman, E. Z., & Goldberger, A. L. (2018). Heart rate fragmentation as a novel biomarker of adverse cardiovascular events: the Multi-Ethnic Study of Atherosclerosis. Frontiers in physiology, 9, 1117. https://doi.org/10.3389/fphys.2018.01117.
- D'Agostino, R. B., Sr, Vasan, R. S., Pencina, M. J., Wolf, P. A., Cobain, M., Massaro, J. M., & Kannel, W. B. (2008). General cardiovascular risk profile for use in primary care: the Framingham Heart Study. Circulation, 117(6), 743–753. https://doi.org/10.1161/CIRCULATIONAHA.107.699579.
- Costa, M. D., Redline, S., Soliman, E. Z., Goldberger, A. L., & Heckbert, S. R. (2021a). Fragmented sinoatrial dynamics in the prediction of atrial fibrillation: the Multi-Ethnic Study of Atherosclerosis. American journal of physiology. Heart and circulatory physiology, 320(1), H256–H271. https://doi.org/10.1152/ajpheart.00421.2020.
- Lensen, I. S., Monfredi, O. J., Andris, R. T., Lake, D. E., & Moorman, J. R. (2020). Heart rate fragmentation gives novel insights into non-autonomic mechanisms governing beat-to-beat control of the heart's rhythm. JRSM cardiovascular disease, 9, 2048004020948732. https://doi.org/10.1177/2048004020948732.
- Berger, M., Pichot, V., Solelhac, G., Marques-Vidal, P., Haba-Rubio, J., Vollenweider, P., Waeber, G., Preisig, M., Barthélémy, J. C., Roche, F., & Heinzer, R. (2022). Association between nocturnal heart rate variability and incident cardiovascular disease events: the HypnoLaus population-based study. Heart rhythm, 19(4), 632–639. https://doi.org/10.1016/j.hrthm.2021.11.033.
- Guichard, J.-B., Pichot, V., Hupin, D., Celle, S., Da Costa, A., Barthelemy, J.-C., & Roche, F. (2022). Heart rate fragmentation as a marker of altered global autonomic nervous system activity: a novel predictor of atrial fibrillation occurrence in the general population. European heart journal, 43(Suppl 2), ehac544.511.
- Costa, M. D., Redline, S., Hughes, T. M., Heckbert, S. R., & Goldberger, A. L. (2021b). Prediction of cognitive decline using heart rate fragmentation analysis: the Multi-Ethnic Study of Atherosclerosis. Frontiers in aging neuroscience, 13, 708130. https://doi.org/10.3389/fnagi.2021.708130.
- Arakaki, X., Arechavala, R. J., Choy, E. H., Bautista, J., Bliss, B., Molloy, C., Wu, D. A., Shimojo, S., Jiang, Y., Kleinman, M. T., & Kloner, R. A. (2023). The connection between heart rate variability (HRV), neurological health, and cognition: a literature review. Frontiers in neuroscience, 17, 1055445. https://doi.org/10.3389/fnins.2023.1055445.
- Heckbert, S. R., Jensen, P. N., Erus, G., Nasrallah, I. M., Rashid, T., Habes, M., Austin, T. R., Floyd, J. S., Schaich, C. L., Redline, S., Bryan, R. N., & Costa, M. D. (2023). Heart rate fragmentation and brain MRI markers of small vessel disease in MESA. Alzheimer's & dementia, 10.1002/alz.13554. Advance online publication. https://doi.org/10.1002/alz.13554.
- Sawayama, Y., Yano, Y., Hisamatsu, T., Fujiyoshi, A., Kadota, A., Torii, S., Kondo, K., Kadowaki, S., Higo, Y., Harada, A., Watanabe, Y., Nakagawa, Y., Miura, K., Ueshima, H., & for the SESSA Research Group. (2023). Heart rate fragmentation, ambulatory blood pressure, and coronary artery calcification: a population-based study. JACC: Asia. Advance online publication. https://doi.org/10.1016/j.jacasi.2023.10.004.
- Costa, M. D. (2024a). Heart rate fragmentation and coronary calcification: a neuroautonomic connection? JACC: Asia. Advance online publication. https://doi.org/10.1016/j.jacasi.2023.11.012.
- Costa, M. D., Heckbert, S. R., Redline, S., & Goldberger, A. L. (2022). Method to quantify the impact of sleep on cardiac neuroautonomic functionality: application to the prediction of cardiovascular events in the Multi-Ethnic Study of Atherosclerosis. American journal of physiology. Regulatory, integrative and comparative physiology, 323(6), R968–R978. https://doi.org/10.1152/ajpregu.00184.2022.
- Costa, M. D., Rangasamy, V., Behera, A., Mathur, P., Khera, T., Goldberger, A. L., & Subramaniam, B. (2024b) Blood pressure fragmentation as a new measure of blood pressure variability: association with predictors of cardiac surgery outcomes. Frontiers in physiology. Advance online publication. doi: 10.3389/fphys.2024.1277592.
- Omoto, A. C. M., Lataro, R. M., Silva, T. M., Salgado, H. C., Fazan, R., Jr, & Silva, L. E. V. (2021). Heart rate fragmentation, a novel approach in heart rate variability analysis, is altered in rats 4 and 12 weeks after myocardial infarction. Medical & biological engineering & computing, 59(11-12), 2373–2382. https://doi.org/10.1007/s11517-021-02441-8.
Access
Access Policy:
Anyone can access the files, as long as they conform to the terms of the specified license.
License (for files):
GNU General Public License version 3
Discovery
DOI (version 1.0.0):
https://doi.org/10.13026/0mzj-gn98
DOI (latest version):
https://doi.org/10.13026/krqe-pj80
Programming Languages:
Topics:
heart rate variability
aging
cardiovascular disease
vagal tone
time series analysis
prediction of atrial fibrillation
cardiac autonomic function
prediction of cardiovascular events
prediction of cognitive decline
heart rate fragmentation
Corresponding Author
Files
Total uncompressed size: 2.5 MB.
Access the files
- Download the ZIP file (2.2 MB)
-
Download the files using your terminal:
wget -r -N -c -np https://physionet.org/files/heart-rate-fragmentation-code/1.0.0/
| Name | Size | Modified |
|---|---|---|
| Fig_1.jpg (download) | 1.0 MB | 2024-01-05 |
| Fig_2.jpg (download) | 144.3 KB | 2024-01-05 |
| Fig_3.jpg (download) | 1.3 MB | 2024-01-05 |
| HRF.awk (download) | 4.5 KB | 2024-01-30 |
| LICENSE.txt (download) | 34.9 KB | 2024-02-14 |
| README (download) | 1.2 KB | 2024-01-04 |
| SHA256SUMS.txt (download) | 721 B | 2024-02-14 |
| timeseries_1PVC.txt (download) | 658 B | 2024-01-03 |
| timeseries_1PVC_1outlier.txt (download) | 660 B | 2024-01-03 |
| timeseries_1PVC_2outliers.txt (download) | 665 B | 2024-01-03 |