Database Open Access
Facial and oral temperature data from a large set of human subject volunteers
Quanzeng Wang , Yangling Zhou , Pejman Ghassemi , Dwith Chenna , Michelle Chen , Jon Casamento , Joshua Pfefer , David Mcbride
Published: May 24, 2023. Version: 1.0.0
When using this resource, please cite:
(show more options)
Wang, Q., Zhou, Y., Ghassemi, P., Chenna, D., Chen, M., Casamento, J., Pfefer, J., & Mcbride, D. (2023). Facial and oral temperature data from a large set of human subject volunteers (version 1.0.0). PhysioNet. https://doi.org/10.13026/3bhc-9065.
Please include the standard citation for PhysioNet:
(show more options)
Goldberger, A., Amaral, L., Glass, L., Hausdorff, J., Ivanov, P. C., Mark, R., ... & Stanley, H. E. (2000). PhysioBank, PhysioToolkit, and PhysioNet: Components of a new research resource for complex physiologic signals. Circulation [Online]. 101 (23), pp. e215–e220.
Abstract
To evaluate the benefit of implementing standardized deployment and acquisition practices in the measurement of elevated body temperature (EBT) with infrared thermographs (IRTs), we conducted a clinical study with more than one thousand subjects. Subject oral temperatures were measured and facial thermal images captured with two evaluated IRTs. Based on the thermal images, temperatures from different locations on the face were extracted based on developed method and are listed in six CSV file as the open database. All data in these files has been de-identified. Based on these data, we published two main clinical study papers, with a focus on IRT effectiveness for EBT measurements and metrics for evaluating IRT clinical accuracy, respectively. Further analysis of this database can still be valuable.
Background
Infrared thermographs (IRTs) have been utilized for measuring elevated body temperature (EBT) during infectious disease outbreaks such as severe acute respiratory syndrome, Ebola virus disease, and coronavirus disease 2019. While IRTs hold promise as a tool for measuring EBT, the literature suggests that their diagnostic performance can be inconsistent, potentially due to wide variations in device quality and implementation methodology. Recommendations for improved measurement of EBT with IRTs have been published in an international standard document [1].
To evaluate the utility of this approach, we performed a clinical thermographic imaging study of more than 1000 subjects, acquiring facial temperature data from different locations with two IRTs that had been evaluated in our lab and reference oral temperature data with an oral thermometer. The aims of this clinical study were to (1) evaluate the performance of IRTs following consensus guidelines, (2) evaluate the effect of facial measurement location, (3) compare methods for IRT calibration, (4) identify best practices for assessing IRT clinical accuracy, and (5) compare IRT clinical accuracy to that of non-contact infrared thermometers.
Since the publication of our initial results [2, 3], we have received much interest from researchers regarding the availability of this data. Given its unique characteristics – including extensive size and rigor in acquisition (e.g., use of an in-frame blackbody to maximize accuracy) – we believe that this data may provide substantial value to both academic and industrial researchers. Furthermore, we are aware of no other publicly available IRT study data set that is currently available. It is our hope that releasing this data will benefit the development of effective thermal imaging systems to enhance public health, whether for standard clinical applications or future pandemics.
Methods
Two evaluated infrared thermographs (IRTs) [4] were used for the clinical study – one from FLIR (IRT-1) and the other from ICI (IRT-2). Originally, data was collected from 1115 subjects, but 6 subjects had incomplete records and 56 subjects had only one oral temperature reading or two oral temperature readings with difference greater than 0.5°C. Additionally, 33 subjects from IRT-1 and 43 subjects from IRT-2 had blurred images caused by motion artifacts. Therefore, data from these subjects were excluded. In total, data from 1020 subjects measured with IRT-1 and 1009 subjects measured with IRT-2 are available for analysis. About 11% of these subjects exhibited reference temperature above 37.5 °C. The demographics of study subjects can be found in our publications [2, 3]. Themethodology employed for the study execution, data collection and initial processing are also detailed in the publications.
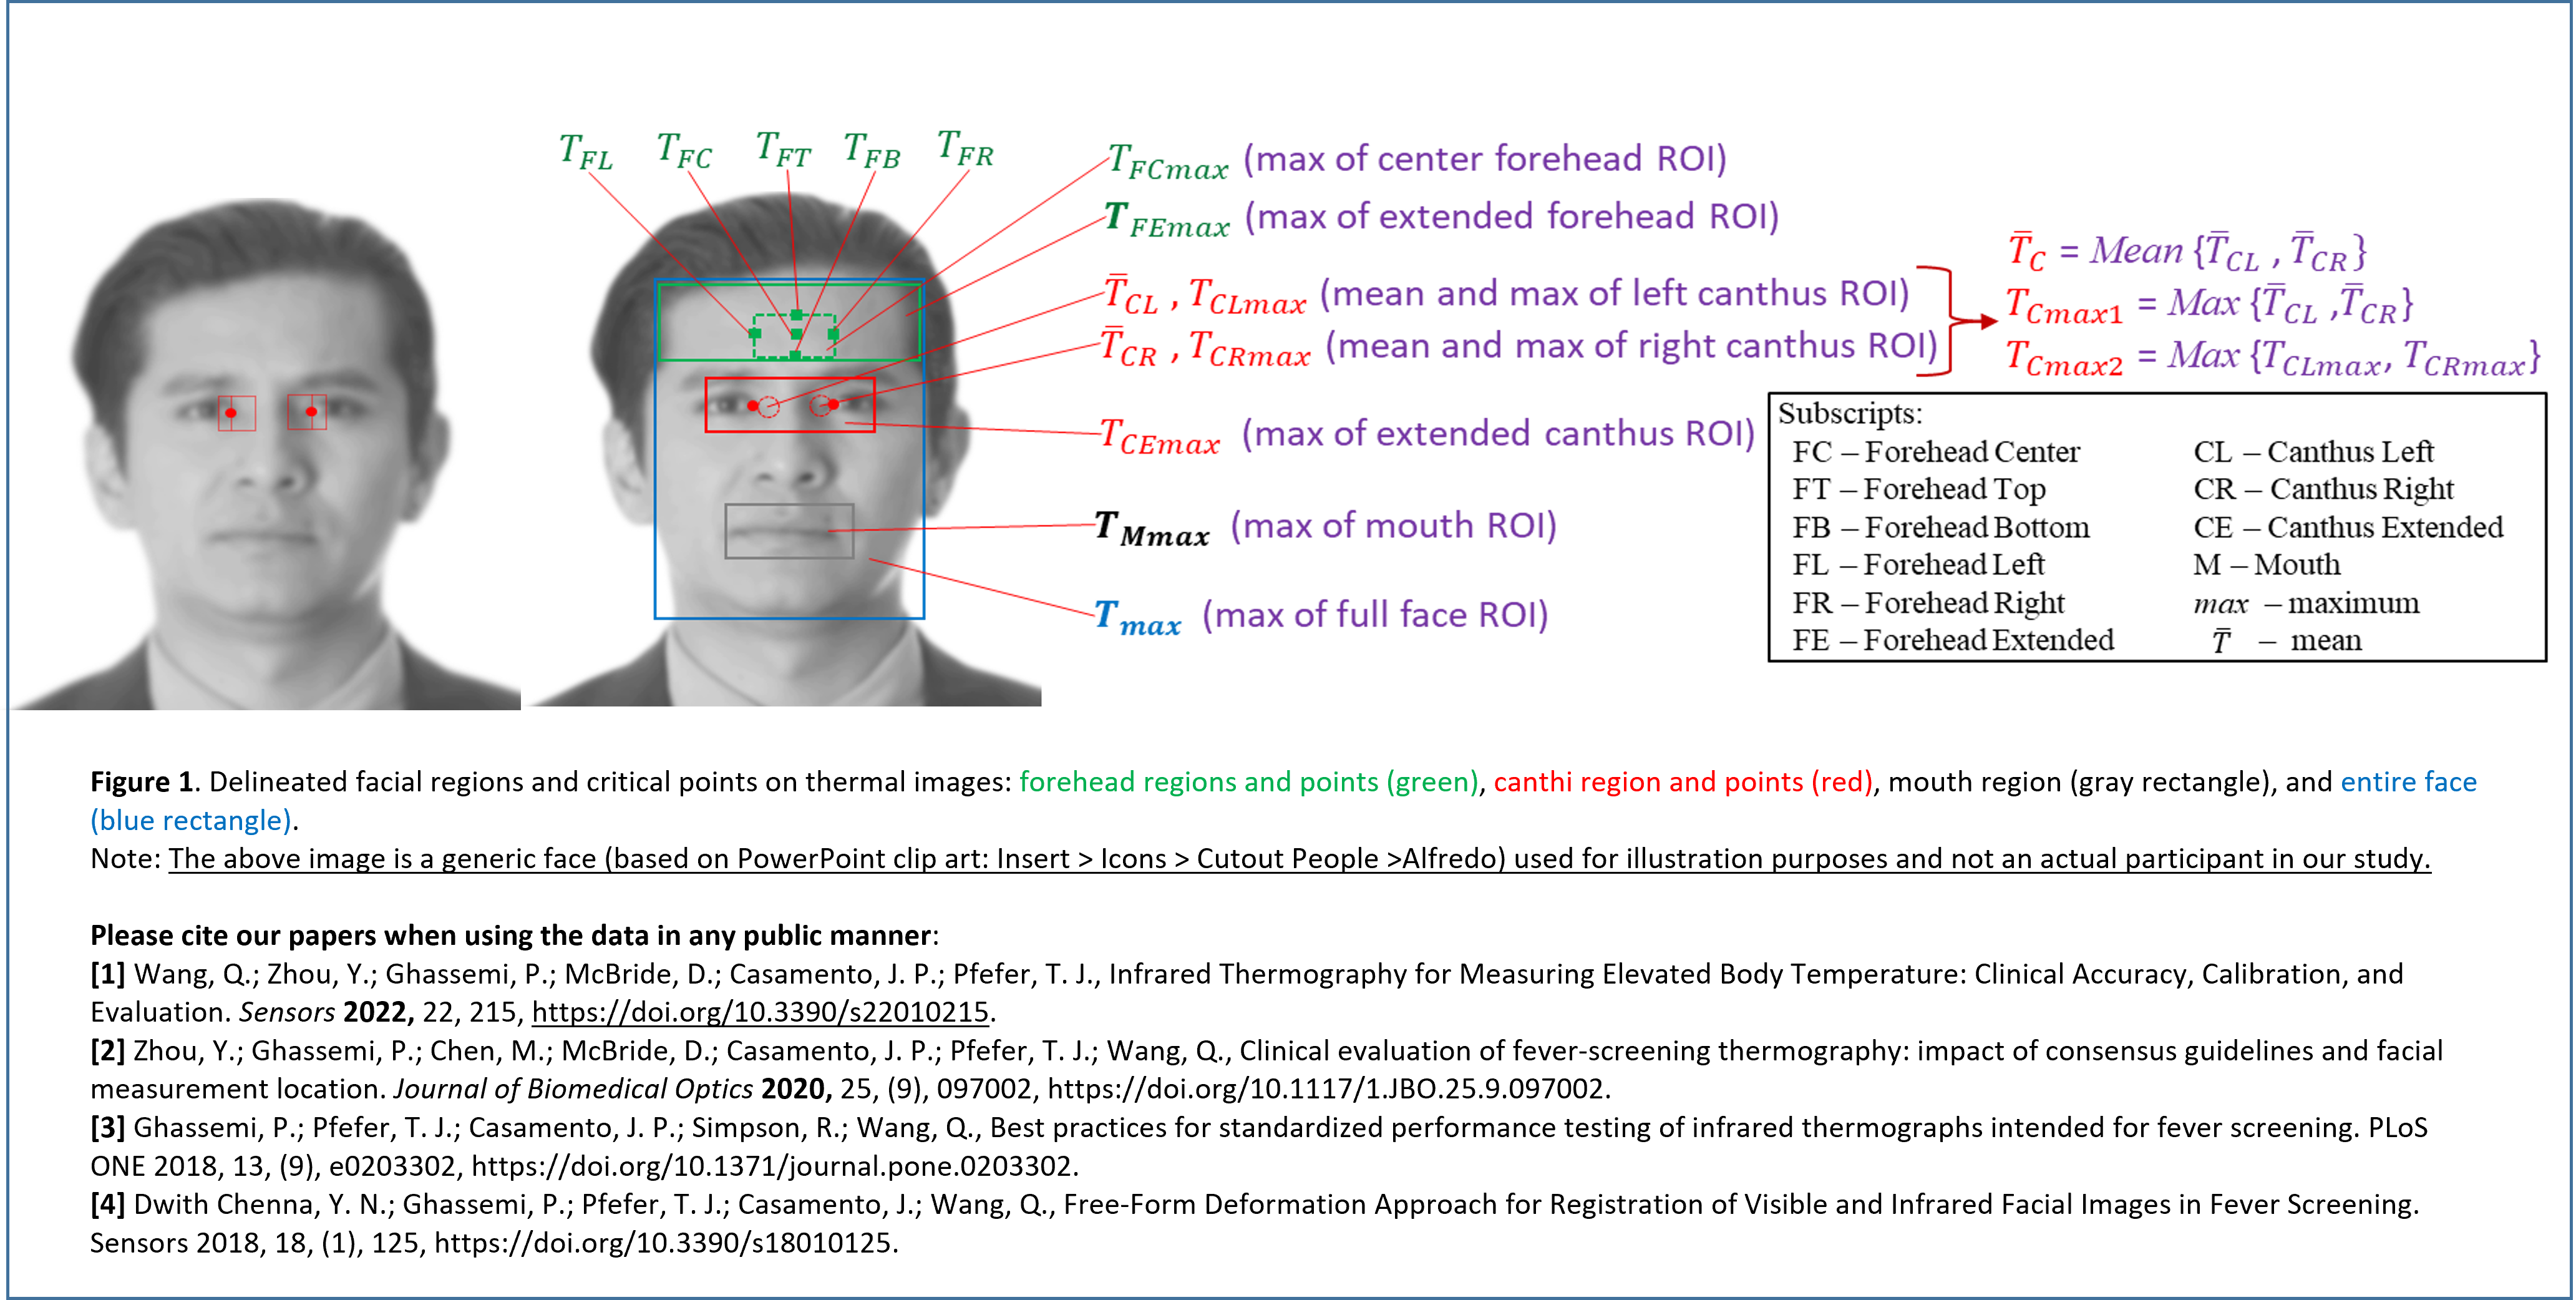
The raw data from the clinical study are mainly thousands of thermal and visible images captured with two evaluated IRTs [4] and a webcam together with oral temperature data measured with an oral thermometer. Based on these raw data, temperatures at different facial locations for each subject were extracted through a free-form deformation approach for registration of visible and infrared facial images [5]. A total of 26 facial temperature variables were defined as explained in the Data Description section. Figure 1 illustrated some of these variables that have been used in our publications [2, 3]. In addition, we recorded the oral temperatures of each subject twice, under two operation modes (fast mode and monitor mode) of the oral thermometer each time. This database includes the average value for each mode. Since the fast mode is less accurate than the monitor mode, only data from the monitor mode were used in our publications. Furthermore, demographic information such as gender, age, ethnicity, ambient temperature, relative humidity, measuring distance, whether cosmetic was applied, and mearing time and date were recorded for each subject and listed in the database. Not every subject has a full record of all these data and any missing data will be shown as empty in the database.
Each patient’s name, age, and measurement date is related to one of the 18 identifiers in the Health Insurance Portability and Accountability Act (HIPAA). According to HIPAA, this identifier includes “All elements of dates (except year) for dates directly related to an individual, including birth date, admission date, discharge date, date of death; and all ages over 89 and all elements of dates (including year) indicative of such age, except that such ages and elements may be aggregated into a single category of age 90 or older”. To comply with HIPAA regulations, we provide age information in terms of groups (e.g., 26-30), and all subjects older than 60 years old were aggregated into a single category of age 60 and above. To protect patient privacy, patient names were replaced with a code based on the measurement date. Therefore, the measurement date acts as a label that cannot be used to identify any subject, especially considering that the Informed Consent Form will be destroyed upon the completion of the project. The measurement date is retained in the database to enable study of seasonal effects.
Disclaimer: The mention of commercial products, their sources, or their use in connection with material reported herein is not to be construed as either an actual or implied endorsement of such products by the Department of Health and Human Services.
Data Description
Two infrared thermographs (IRTs) [4] were used for the clinical study – one from FLIR (IRT-1) and the other from ICI (IRT-2). The infrared images for each IRT were separated into two groups—Group 1 with ambient temperature ranged from 20.0 to 24.0 °C and Group 2 from 24.0 to 29.0 °C. The temperature ranges are different owing to large ambient temperature variation in the clinic during the study. Group 1 data were first analyzed with a focus on IRT effectiveness for EBT measurements [2], since ISO/TR 13154:2017 [1] recommends an ambient temperature range of 20–24 °C. We analyzed Group 2 data with the same methodology as Group 1 data analysis in terms of the correlation coefficients and the area under the curve (AUC) values for different receiver operator characteristic (ROC, described further in Section 2.6.2) curves. The results show that both groups have similar performance in terms of correlation coefficients and AUC values. Therefore, we analyzed Group 1 and Group 2 data together in our second publication [3], with the focus on clinical accuracy, calibration, and evaluation of IRTs for Measuring Elevated Body Temperature.
The name of each CSV file includes two parts, camera names (FLIR or ICI, representing IRT-1 and IRT-2 in our publications) and data group (group 1, group 2, or groups 1 and 2) separated by “_”. There are totally six CSV files as follows:
- “FLIR_group1”: Group 1 data based on IR images captured by the FLIR camera (IRT-1).
- “ICI_group1”: Group 1 data based on IR images captured by the ICI camera (IRT-2).
- “FLIR_group2”: Group 2 data based on IR images captured by the FLIR camera (IRT-1).
- “ICI_group2”: Group 2 data based on IR images captured by the ICI camera (IRT-2).
- “FLIR_groups1and2”: combination of “FLIR_group1” and “FLIR_group2”.
- “ICI_groups1and2”: combination of “ICI_group1” and “ICI_group2”.
Table 1 provides the definitions for the 26 facial temperature variables in each CSV file. Table 2 provides the definitions for all other variables.
Perhaps the most significant caveat to our results is the limited age range of the study population. Overall, 95% of subjects were under 30 years of age and about half were in the 18–21 range. Therefore, the data are not representative of the age of the overall population. Since the data were collected under reasonably well-controlled environments given seasonal variations, it may not be appropriate to extrapolate the results to extreme conditions, such as excessively high or low temperatures or high humidity levels.
Usage Notes
We are not aware of any other publicly available IRT study database. This database holds significant potential value for both academic and industrial researchers. It enables analysis of correlation coefficients between temperature values at various body sites, as measured by different devices. Additionally, researchers can evaluate the impact of different parameters such as gender, age, ethnicity, and ambient temperature. By releasing this database, we aim to contribute to the advancement of effective thermal imaging systems, thereby enhancing public health in standard clinical applications and future pandemics.
Ethics
Both Food and Drug Administration (FDA) and UMD Institutional Review Boards (IRBs) approved this study under FDA IRB study #16-011R and written informed consent was obtained from all subjects. All experiments were performed in accordance with relevant guidelines and regulations. We ensure that the data are de-identified in accordance with the original human subject protocol for our study and that this release complies with our understanding of FDA IRB policies and standard operating procedures and all federal and state regulations guiding the privacy of human subject research data.
Acknowledgements
Conflicts of Interest
The authors have no conflicts of interest to declare.
References
- ISO/TR 13154: Medical electrical equipment — Deployment, implementation and operational guidelines for identifying febrile humans using a screening thermograph, ISO, Geneva, Switzerland, 2017.
- Y. Zhou et al., "Clinical evaluation of fever-screening thermography: impact of consensus guidelines and facial measurement location," Journal of Biomedical Optics, vol. 25, no. 9, p. 097002, 2020, doi: https://doi.org/10.1117/1.JBO.25.9.097002.
- Q. Wang, Y. Zhou, P. Ghassemi, D. McBride, J. P. Casamento, and T. J. Pfefer, "Infrared Thermography for Measuring Elevated Body Temperature: Clinical Accuracy, Calibration, and Evaluation," Sensors, vol. 22, p. 215, 2022, doi: https://doi.org/10.3390/s22010215.
- P. Ghassemi, T. J. Pfefer, J. P. Casamento, R. Simpson, and Q. Wang, "Best practices for standardized performance testing of infrared thermographs intended for fever screening," PLoS ONE, vol. 13, no. 9, p. e0203302, 2018, doi: https://doi.org/10.1371/journal.pone.0203302.
- Y. N. Dwith Chenna, P. Ghassemi, T. J. Pfefer, J. Casamento, and Q. Wang, "Free-Form Deformation Approach for Registration of Visible and Infrared Facial Images in Fever Screening," Sensors, vol. 18, no. 1, p. 125, 2018, doi: https://doi.org/10.3390/s18010125.
Access
Access Policy:
Anyone can access the files, as long as they conform to the terms of the specified license.
License (for files):
Creative Commons Zero 1.0 Universal Public Domain Dedication
Discovery
DOI (version 1.0.0):
https://doi.org/10.13026/3bhc-9065
DOI (latest version):
https://doi.org/10.13026/9ay4-2c37
Topics:
clinical accuracy
receiver operating characteristic curve
infectious disease epidemics
thermography
fever screening
thermometry
inner canthus
elevated body temperature
facial maximum temperatures
infrared thermograph
pearson correlation coefficients
Corresponding Author
Files
Total uncompressed size: 4.5 MB.
Access the files
- Download the ZIP file (2.4 MB)
-
Download the files using your terminal:
wget -r -N -c -np https://physionet.org/files/face-oral-temp-data/1.0.0/
| Name | Size | Modified |
|---|---|---|
| FLIR_group1.csv (download) | 383.4 KB | 2023-05-16 |
| FLIR_group2.csv (download) | 336.0 KB | 2023-05-16 |
| FLIR_groups1and2.csv (download) | 717.8 KB | 2023-05-16 |
| ICI_group1.csv (download) | 357.5 KB | 2023-05-16 |
| ICI_group2.csv (download) | 310.0 KB | 2023-05-16 |
| ICI_groups1and2.csv (download) | 665.8 KB | 2023-05-16 |
| LICENSE.txt (download) | 6.5 KB | 2023-05-24 |
| SHA256SUMS.txt (download) | 802 B | 2023-05-24 |
| _Figure1.png (download) | 1.6 MB | 2023-05-16 |
| _Table1.pdf (download) | 101.9 KB | 2023-05-16 |
| _Table2.pdf (download) | 96.2 KB | 2023-05-16 |